More giant companions, or heavier ones?
A census of 719 stars separates how often giant companions occur from how their masses compare with the stars they orbit.
Article link
Two different population questions
Finding more giant companions around one class of stars does not automatically mean those companions are heavier. Judah Van Zandt and Brendan Bowler examine both questions in a reanalysis of the California Legacy Survey.[1]
The study spans 719 F-, G-, K- and M-type stars, combining radial velocities with Hipparcos–Gaia astrometry to constrain true companion masses. It accounts for survey completeness and parameter uncertainty.[1]
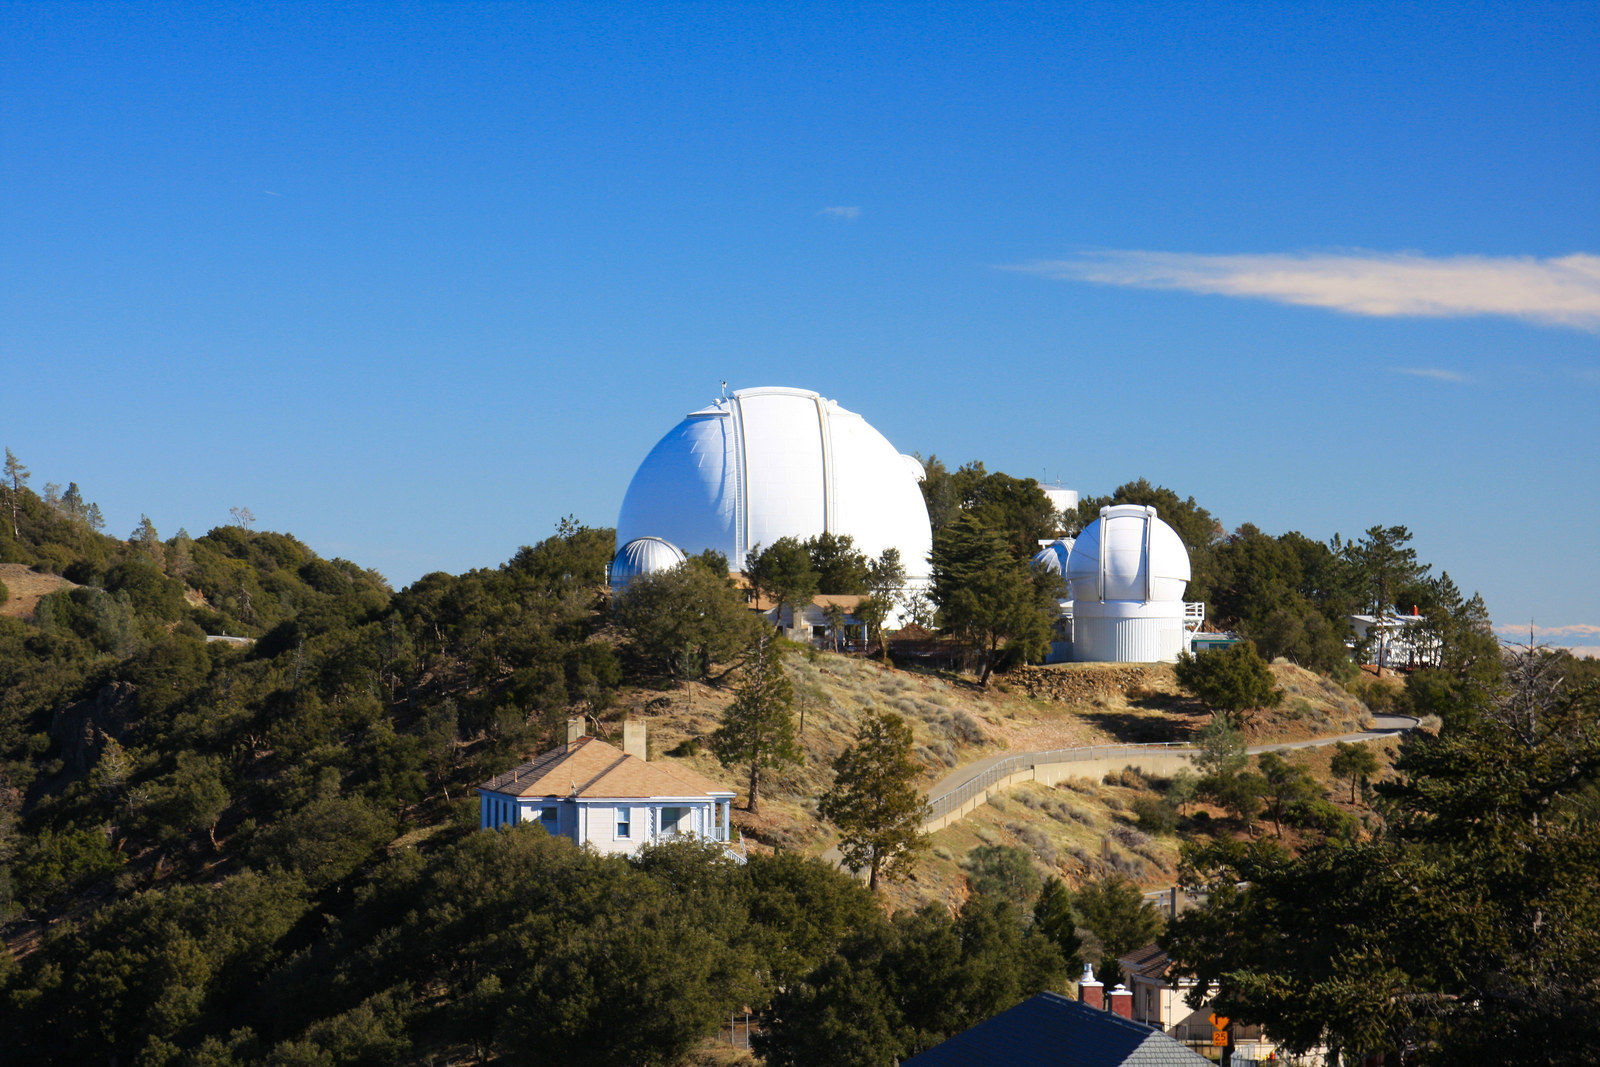
The 2021 survey catalog drew on Keck-HIRES, APF-Levy and Lick-Hamilton radial velocities.[3]
The 2026 analysis covers companion masses of 0.4–50 Jupiter masses and orbital semi-major axes of 0.1–10 AU, including brown dwarfs as well as giant planets. The findings apply to this defined survey sample.[2]
A rate is not a host percentage
Above the Sun’s mass, the estimated rate is 0.39 companions per star (+0.06/−0.05), versus 0.11 ± 0.02 at or below it. These are rates of companions, not percentages of stars with companions.[2]
The higher-mass group is also more metal-rich. Because both properties vary, splitting on mass alone cannot isolate mass’s influence. The authors also compare subsamples split on both properties.[2]
What changes when the star sets the scale
The authors report only about 2–3 sigma evidence that the companion mass distribution shifts toward heavier companions. The stronger occurrence result should not be confused with this more tentative shape result.[1]
Using companion mass divided by stellar mass, the higher- and lower-mass host groups have distribution shapes consistent at 1.6 sigma. Doubling both masses, for example, leaves their ratio unchanged.[2]
A common relative-mass shape is a possibility, not proof that the stellar groups are identical. The analysis does not establish causation.[2]
This explanation uses arXiv v1, submitted 2 November 2026. Its author comment says submitted to AJ; journal acceptance is not established here.[1]
Sources & further reading
- The Giant Planet Mass Function Across Stellar Mass and Metallicity: Massive Stars Make Massive PlanetsarXiv recordPublished November 2, 2026Accessed November 5, 2026
Version 1 abstract, submission and author comment.
- Full manuscript, version 1arXiv manuscriptPublished November 2, 2026Accessed November 5, 2026
Sections II–V and Tables 3–5.
- The California Legacy Survey. I. A Catalog of 178 Planets…CaltechAUTHORSPublished July 1, 2021Accessed November 5, 2026
2021 catalog abstract and facility list.
Keep exploring
What TESS’s Neptune ridge actually measures
A population study finds a concentration of planets on short orbits. Understanding its comparison matters as much as the twofold headline.
Read story
TOI-4129 b at the Neptune ridge’s inner edge
A preprint reports confirmation of a 3.27-day planet using transits and stellar-wobble measurements.
Read story
A 2025 study reported a planet candidate in TWA 7’s debris ring
A JWST source observed in 2024 fits a cool companion, while follow-up supports the interpretation without yet testing shared motion.
Read story